Aurora Watch – Live Space Weather Dashboard
A Flask application that transforms live NOAA space weather data into an intuitive dashboard for tracking aurora conditions and viewing forecasts in real time.
Role:
UX/UI Design • Front-End Development
UX/UI Design • Front-End Development
Tools:
Python • Flask • HTML • CSS • Jinja2 • REST APIs
Python • Flask • HTML • CSS • Jinja2 • REST APIs
Timeline:
Personal Project • 2026
Personal Project • 2026
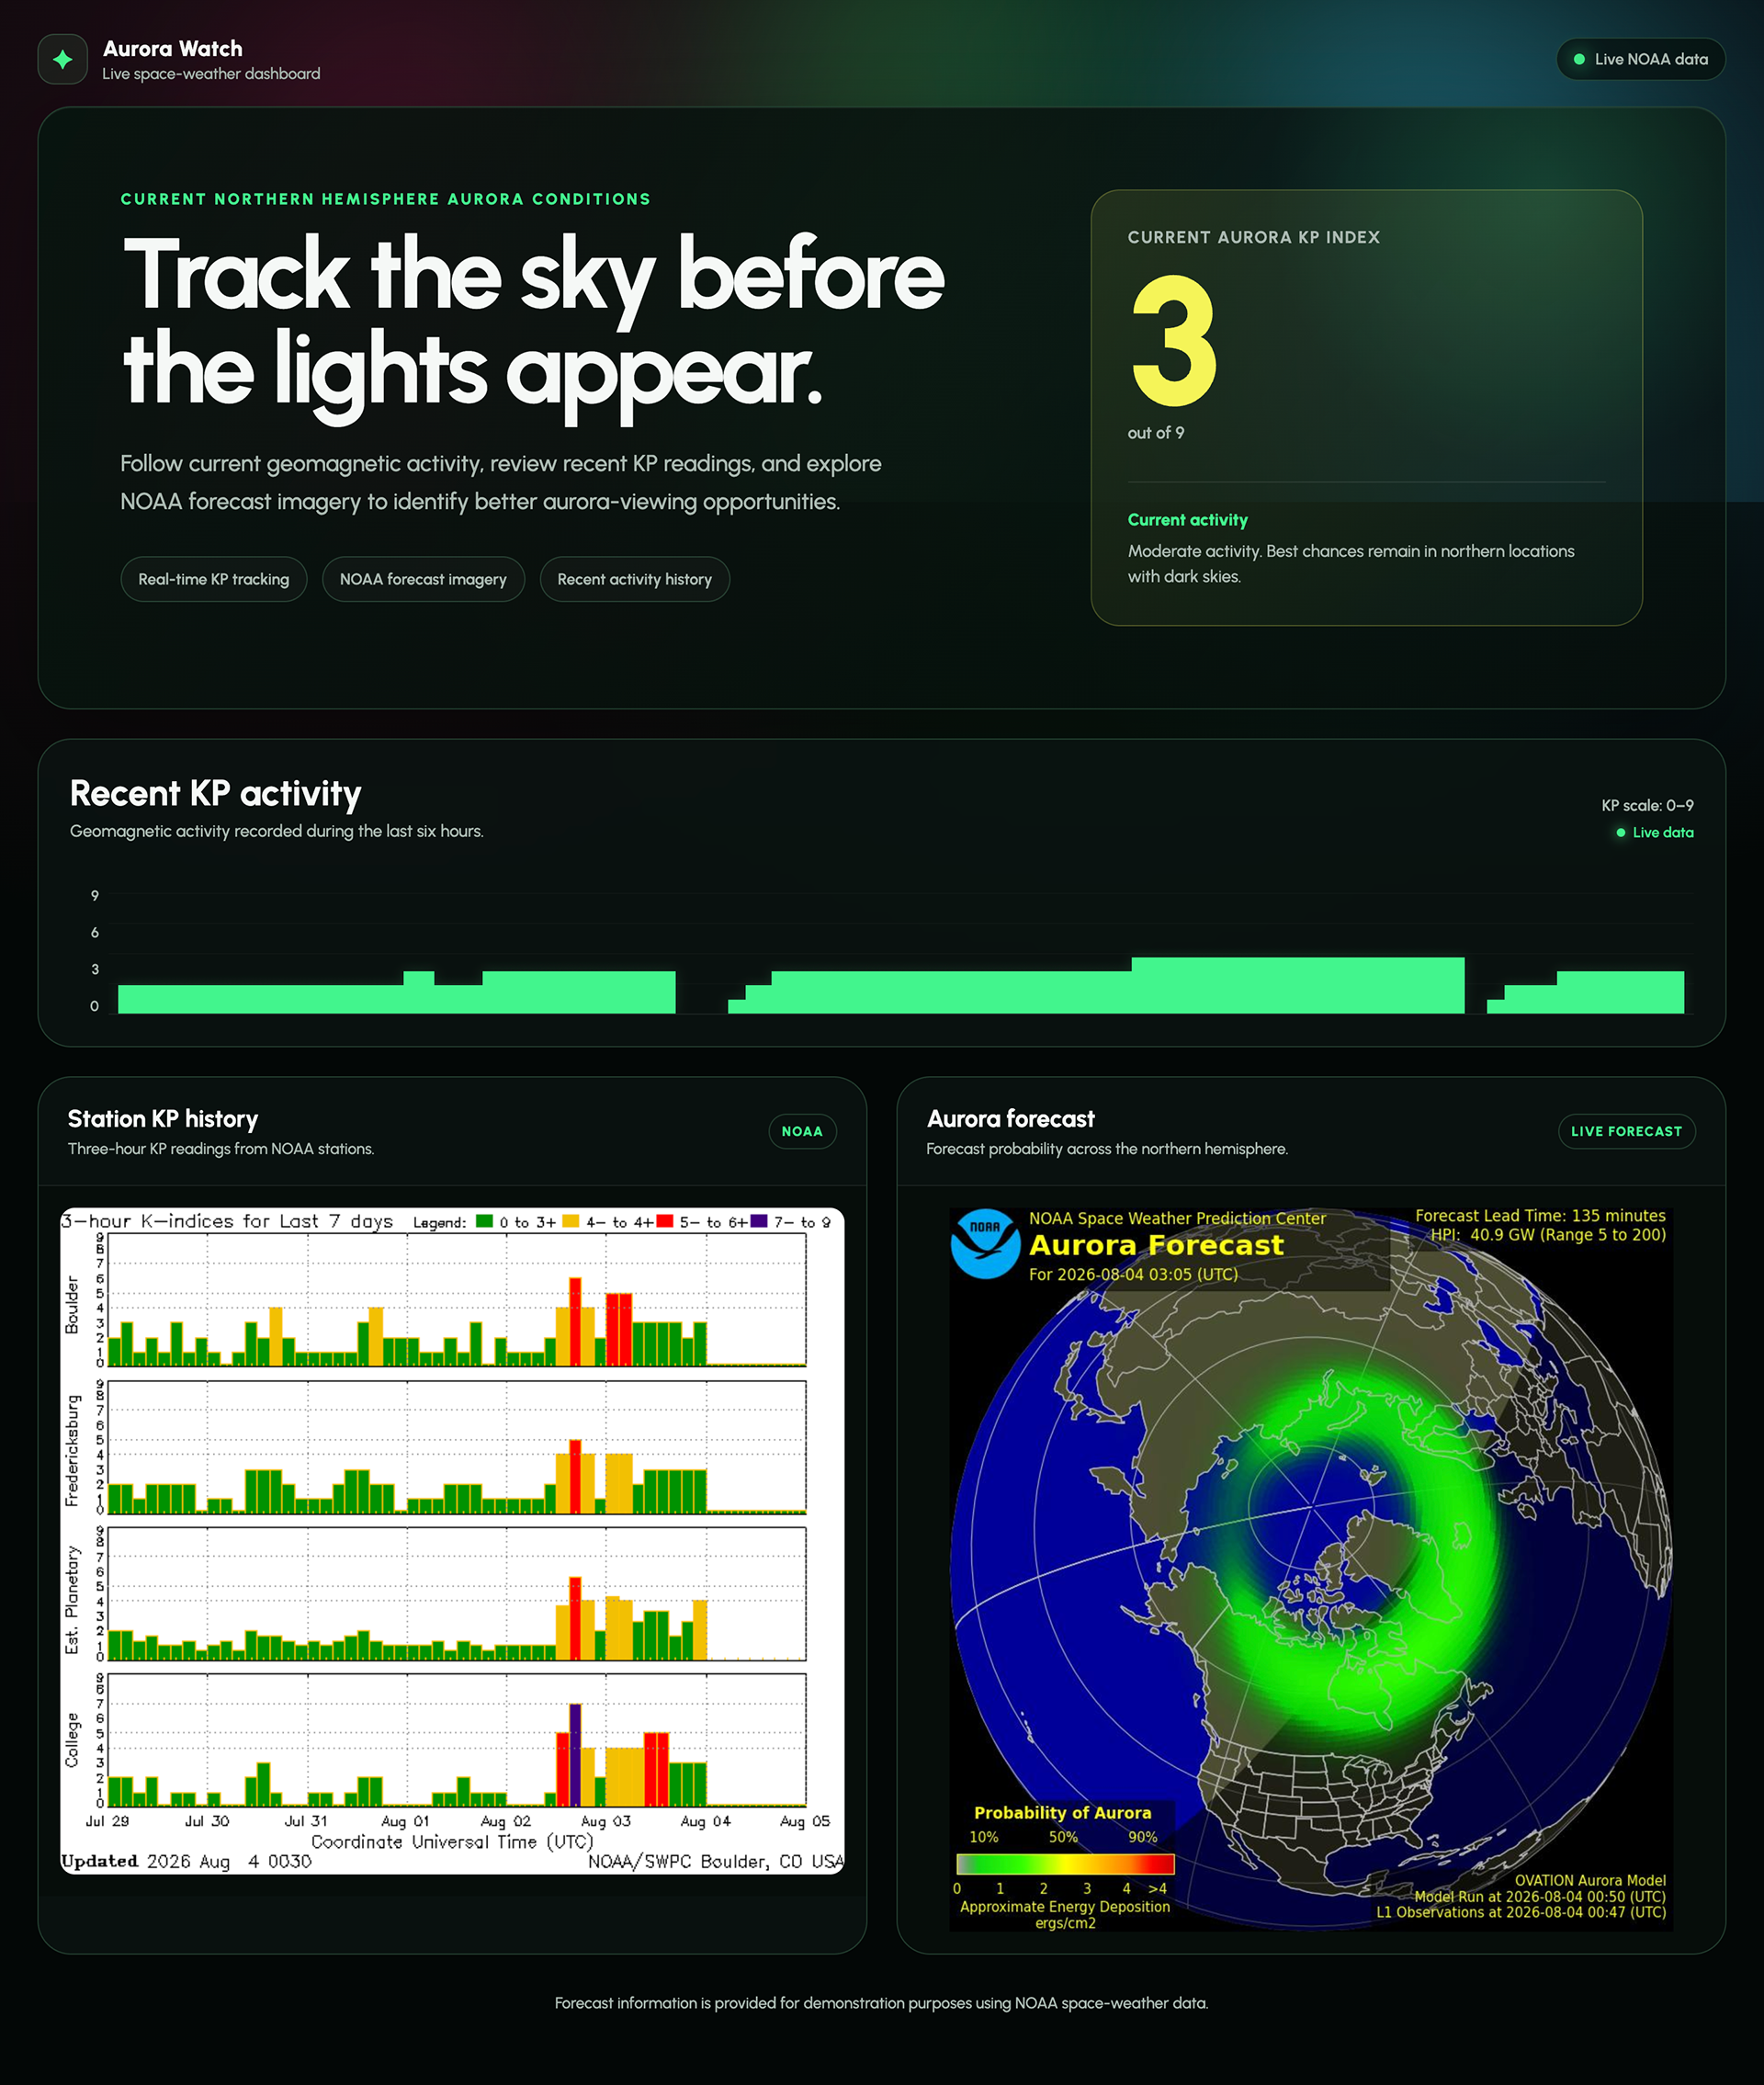
Live dashboard combining NOAA space weather data with custom visualizations to make aurora conditions easier to understand at a glance.
Design Decisions
Rather than displaying raw NOAA data tables, I focused on creating a dashboard that surfaces the information users care about first. The current activity level, timeline, and forecast imagery are prioritized to reduce cognitive load while still exposing the underlying data.
Technical Details
• Python
• Flask
• Jinja2
• REST APIs
• JSON parsing
• Responsive CSS Grid
• CSS animations
• Flask
• Jinja2
• REST APIs
• JSON parsing
• Responsive CSS Grid
• CSS animations
Challenges
• Visualizing minute-by-minute KP data
• Making NOAA imagery fit naturally into a dashboard
• Balancing animation with readability
• Designing a timeline that works across screen sizes
• Making NOAA imagery fit naturally into a dashboard
• Balancing animation with readability
• Designing a timeline that works across screen sizes