Merchant Console for Detour Deals
A web dashboard for merchants to create, manage, and analyze proximity based offers that connect real world locations with the Detour Deals app.
The Detour Deals Merchant Console is a web based dashboard that allows local merchants to create offers, manage deal activity, and monitor performance across real world locations. It complements the mobile app by giving merchants simple tools to place deals anywhere their customers already are.
Designed for clarity, efficiency, and low learning curve even for non-technical business owners.
Role: Product Designer
Scope: Information architecture, dashboard layouts, wireframes, flow design, system logic
Tools: Figma, FigJam
Timeline: 1–2 weeks
Scope: Information architecture, dashboard layouts, wireframes, flow design, system logic
Tools: Figma, FigJam
Timeline: 1–2 weeks
Design Goal
A simple, modular dashboard where merchants create location-based deals, pick where they appear, and track unlocks and redemptions. Built to support future drag-and-drop customization.
Competitive Research
I reviewed publicly available merchant dashboards, onboarding flows, demos, and product documentation to understand how merchants create promotions and track performance.
I also drew from my experience using Datadog, Tableau, and Google Analytics in past roles:
• Datadog showed how flexible, customizable dashboards help users spot patterns quickly.
• Tableau demonstrated the value of clean, logical data layouts, even with limited customization.
• Google Analytics highlighted strong trend visualization but also how overly complex navigation can slow users down.
• Tableau demonstrated the value of clean, logical data layouts, even with limited customization.
• Google Analytics highlighted strong trend visualization but also how overly complex navigation can slow users down.
Across all tools, one theme emerged:
Merchants need clear, actionable insights without having to learn a complicated analytics system. This guided the structure and visual hierarchy of the Detour Deals dashboard.
Merchants need clear, actionable insights without having to learn a complicated analytics system. This guided the structure and visual hierarchy of the Detour Deals dashboard.
Opportunity
Most small merchants don’t have time to learn complex analytics tools. Existing dashboards often fall into two extremes:
• overly simple (showing only basic totals)
• overly complex (requiring training to use effectively).
For Detour Deals, merchants need a middle ground:
• A clear view of how their deals are performing
• Simple ways to create, publish, and manage offers
• Enough insight to understand what’s working, without navigating dozens of screens
• A layout that feels familiar (cards, tables, filters) but optimized for the specific mechanics of geo placed deals
• Make the admin enjoyable and fun so you'd want to engage with it.
Who It’s For
The Small Business Owner
Runs a single shop, café, or boutique. Needs a fast, no nonsense way to publish deals and see whether they’re working. Wants clarity, not complexity.
Runs a single shop, café, or boutique. Needs a fast, no nonsense way to publish deals and see whether they’re working. Wants clarity, not complexity.
The Marketing Manager
Handles promotions for a growing business or multiple locations. Values control, transparency, and performance insights, especially how real world placement impacts engagement.
Handles promotions for a growing business or multiple locations. Values control, transparency, and performance insights, especially how real world placement impacts engagement.
The Event or Pop Up Vendor
Appears at farmers markets, fairs, or seasonal events. Uses the dashboard to place deals at high traffic locations and track unlocks without needing a full CRM or loyalty system.
Appears at farmers markets, fairs, or seasonal events. Uses the dashboard to place deals at high traffic locations and track unlocks without needing a full CRM or loyalty system.
Potential Impact
A focused merchant dashboard like this could help small businesses understand which deals perform best, where customers are discovering them, and how location placement affects engagement. Even lightweight analytics can guide smarter promotions, reduce guesswork, and support better decision making over time.
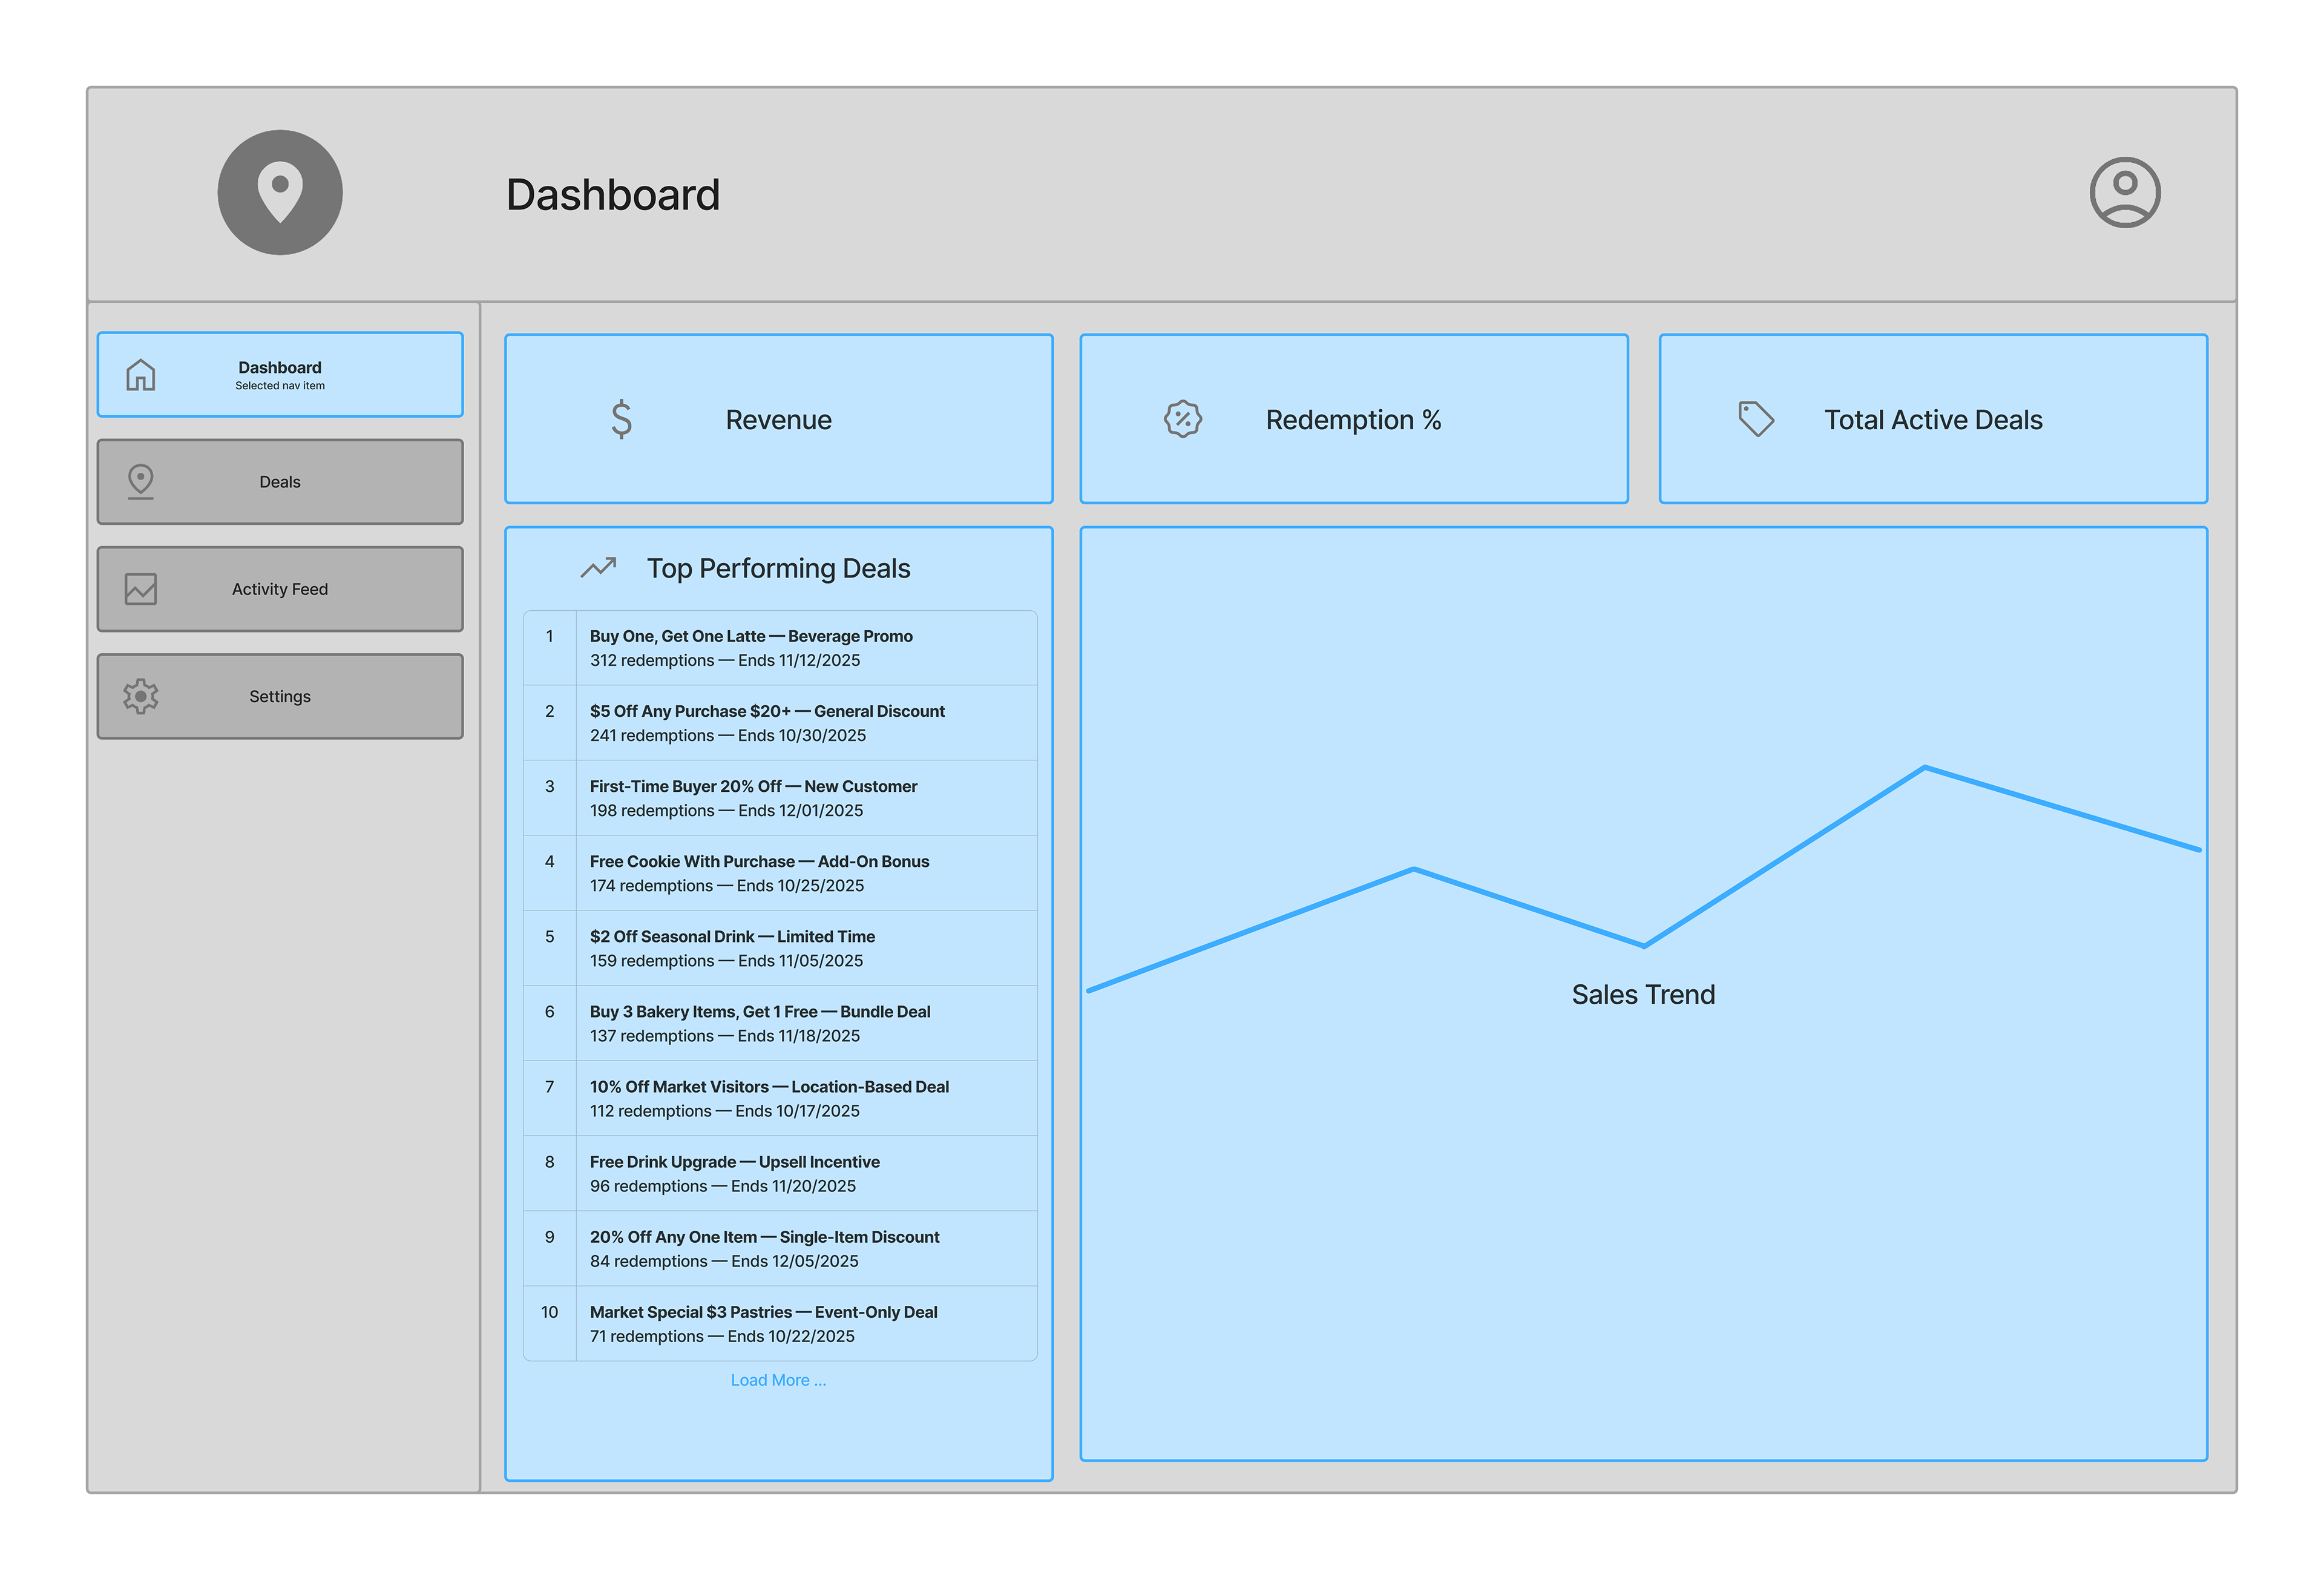
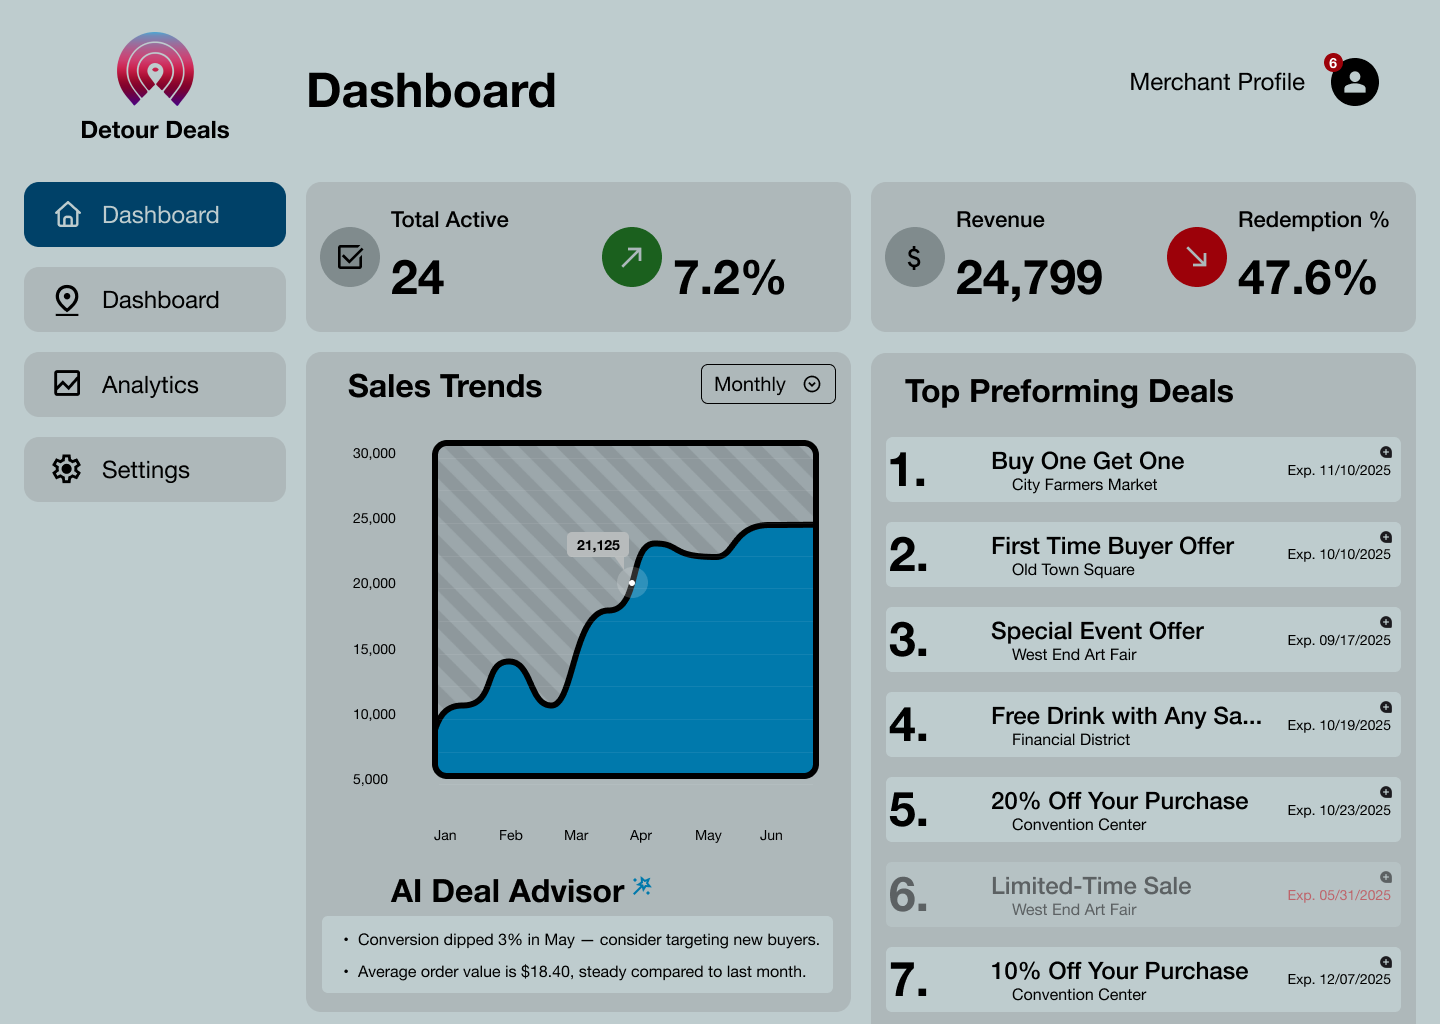
Dashboard Overview
Snapshot of active deals, performance metrics, and recent activity.
Snapshot of active deals, performance metrics, and recent activity.
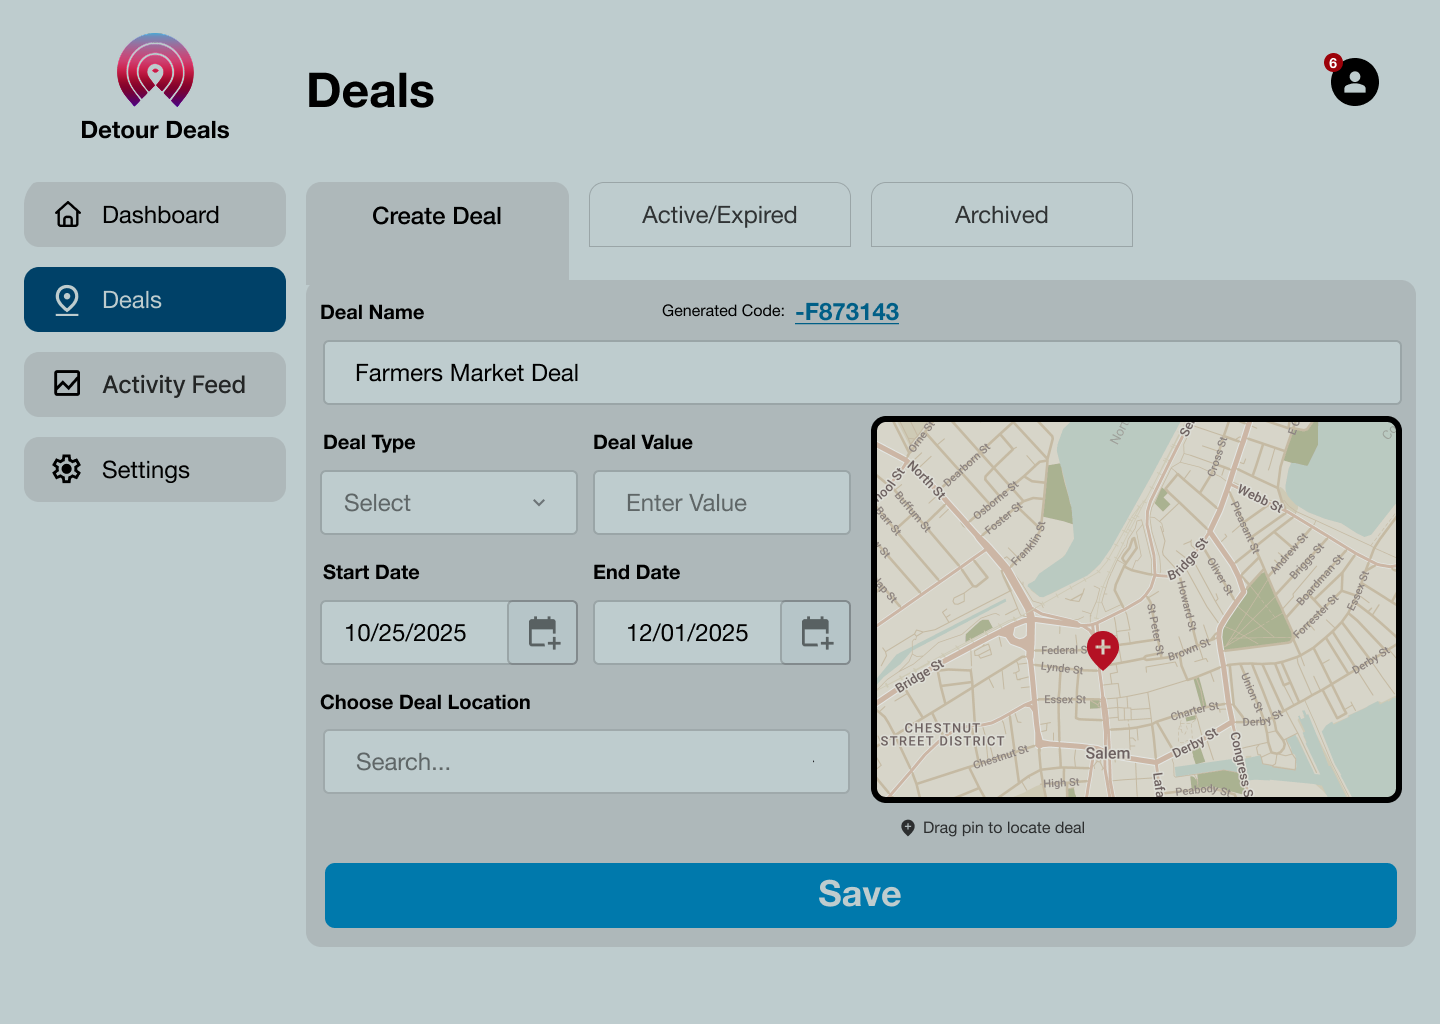
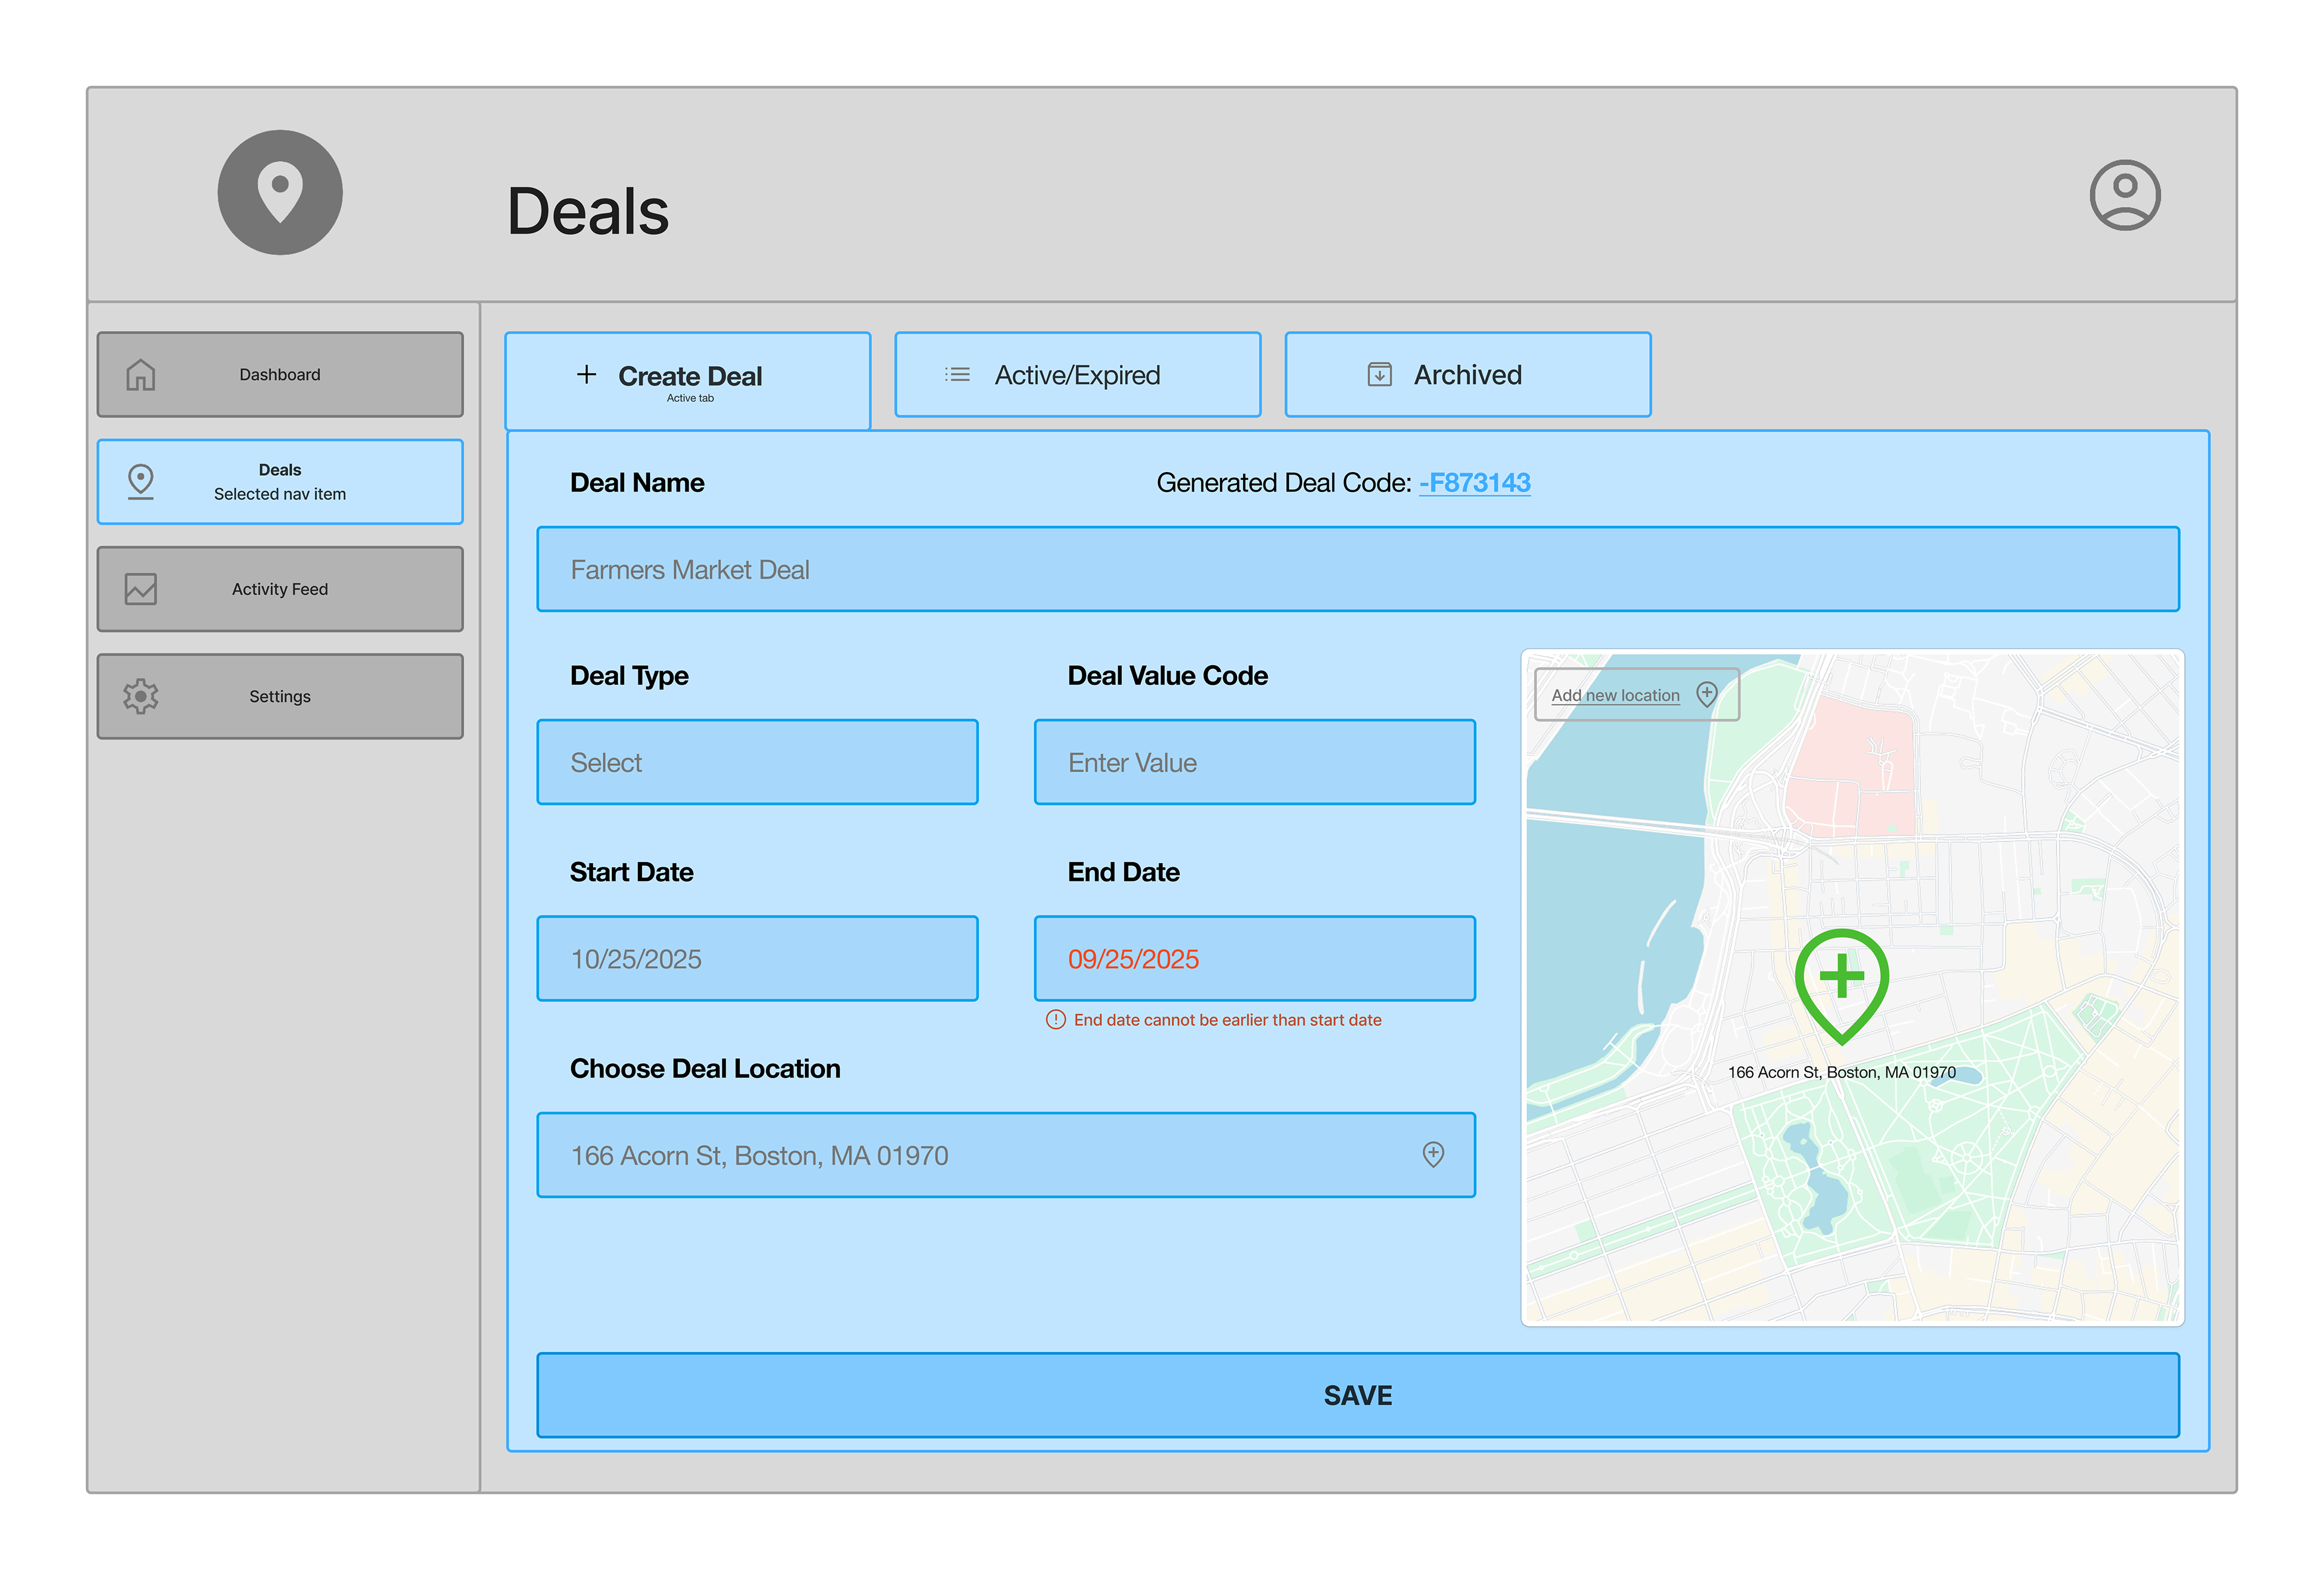
Deals Management
Merchants create, edit, and publish deals tied to specific locations.
Merchants create, edit, and publish deals tied to specific locations.
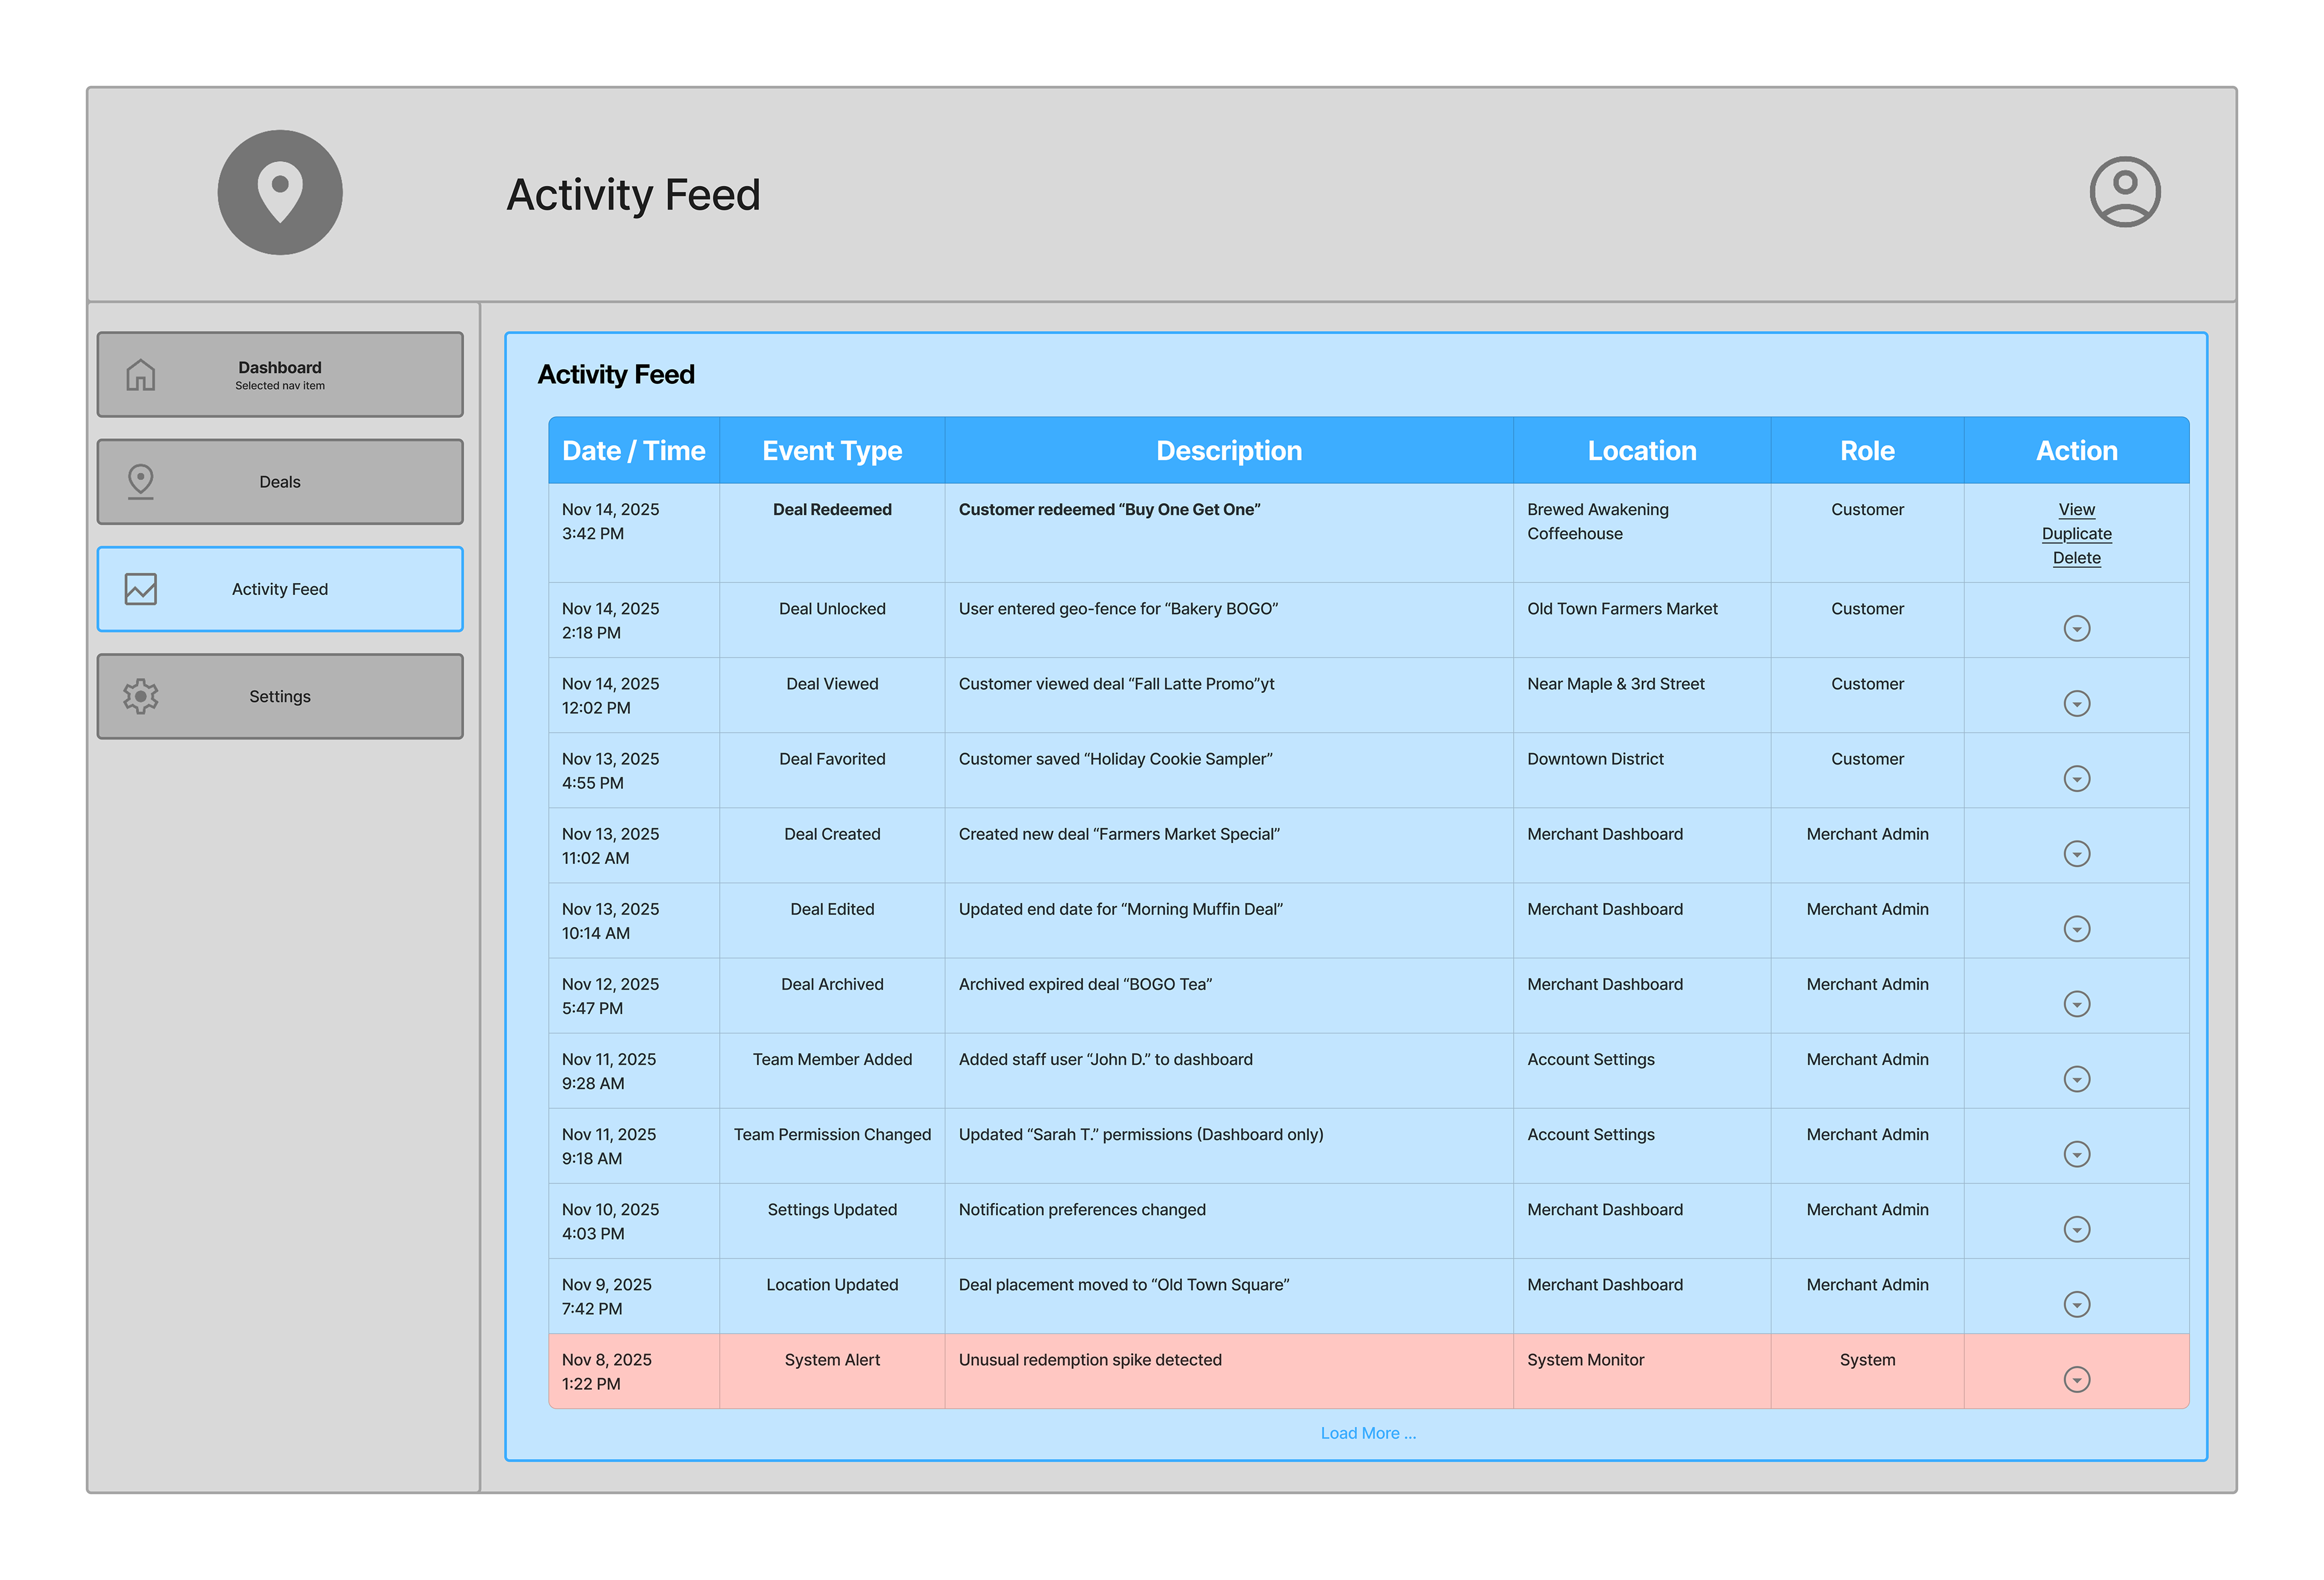
Activity Log
Tracks unlocks, redemptions, and merchant/team actions in a simple chronological feed.
Tracks unlocks, redemptions, and merchant/team actions in a simple chronological feed.
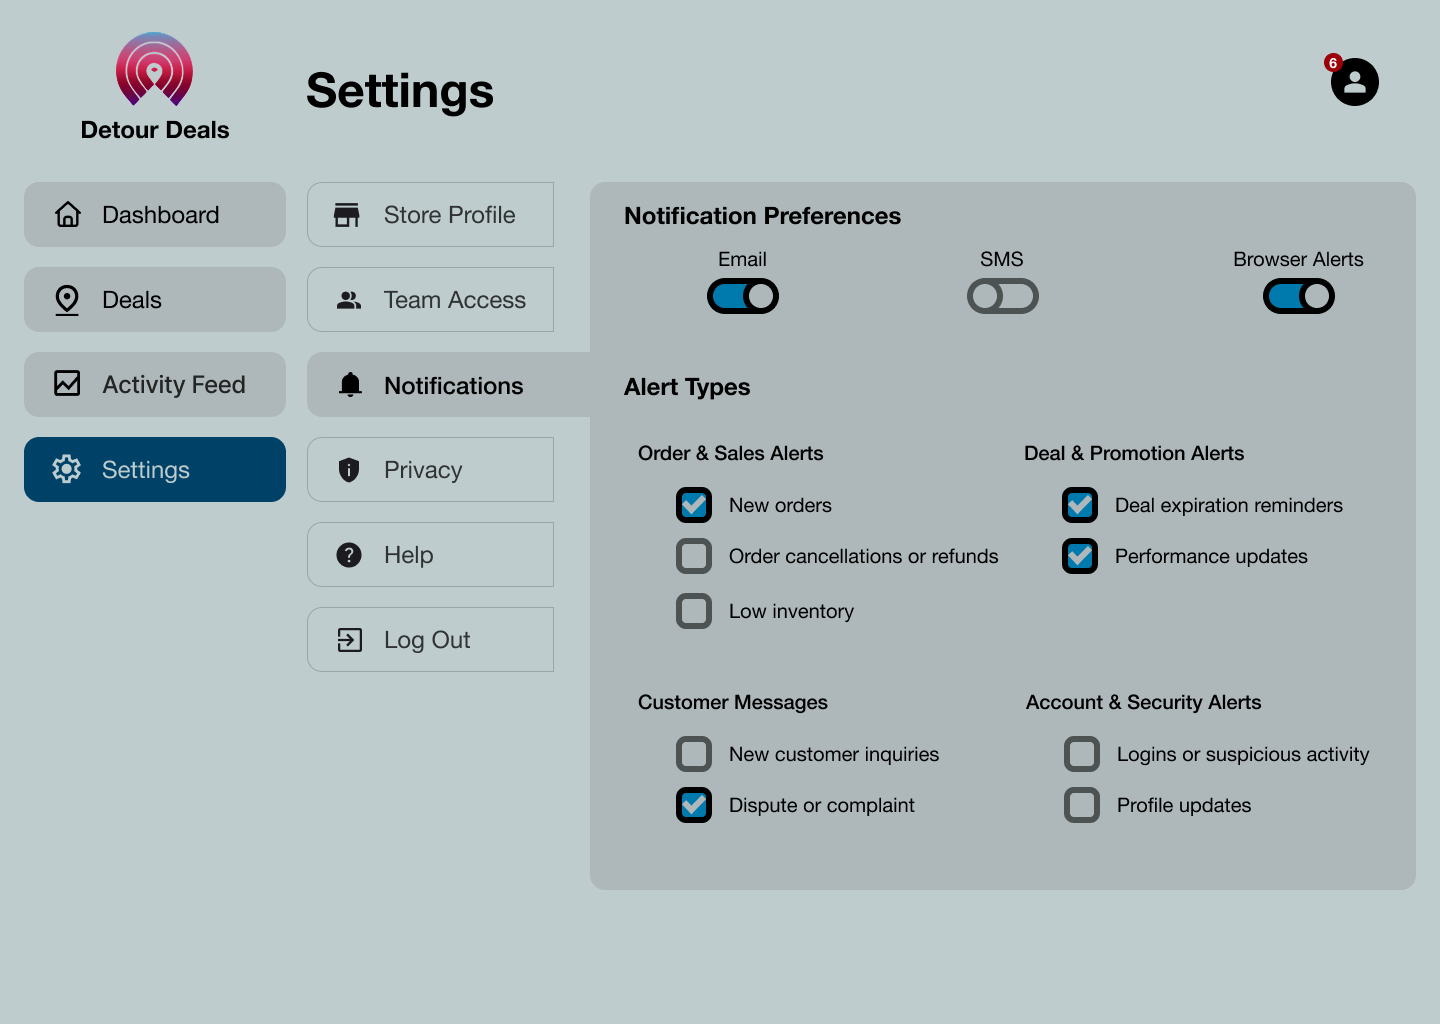
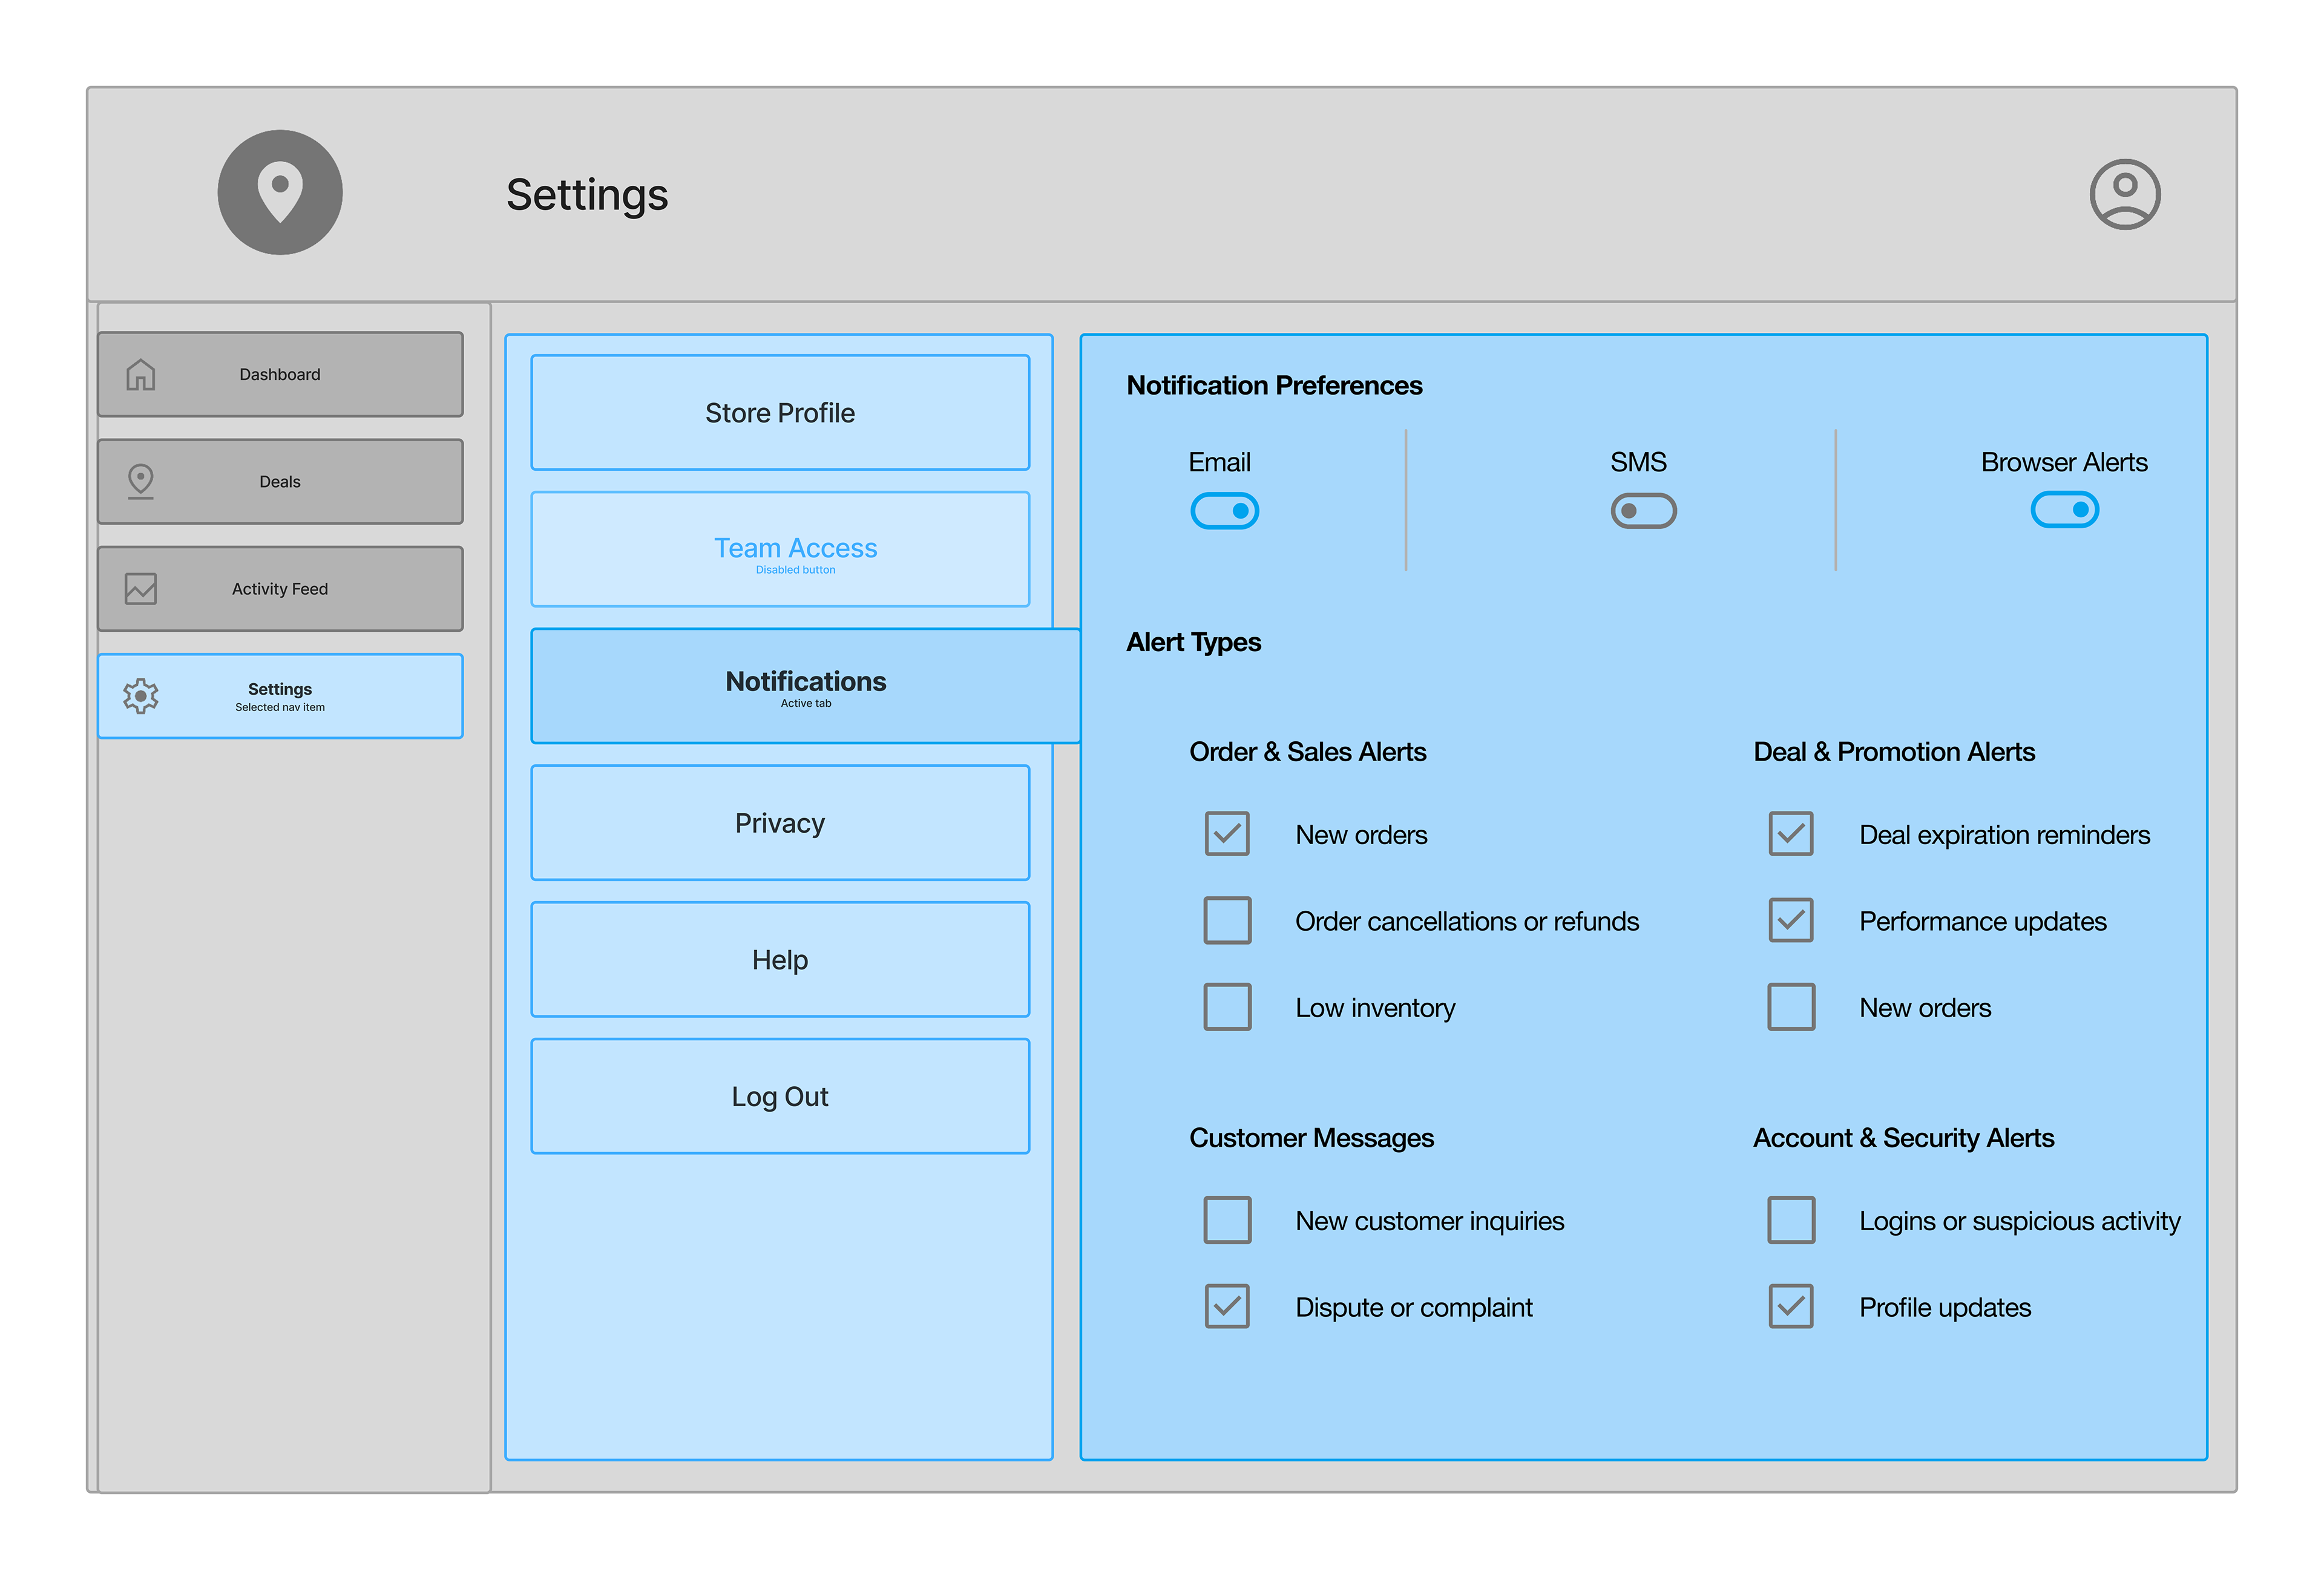
Settings Panel
Basic business info, team access, and general preferences.
Basic business info, team access, and general preferences.
Reflection
This dashboard helped me think through the merchant side of the system and what tools they’d realistically need to manage location based deals. The structure feels close to what I’d expect to use myself: clean inputs, clear activity logs, and simple performance summaries.
I still see open questions around fraud prevention and verifying that a user was truly at the tagged location, and I’d explore ways to strengthen that flow in a next iteration. I’d also like to develop a more cohesive visual theme and eventually move this into high fidelity screens.
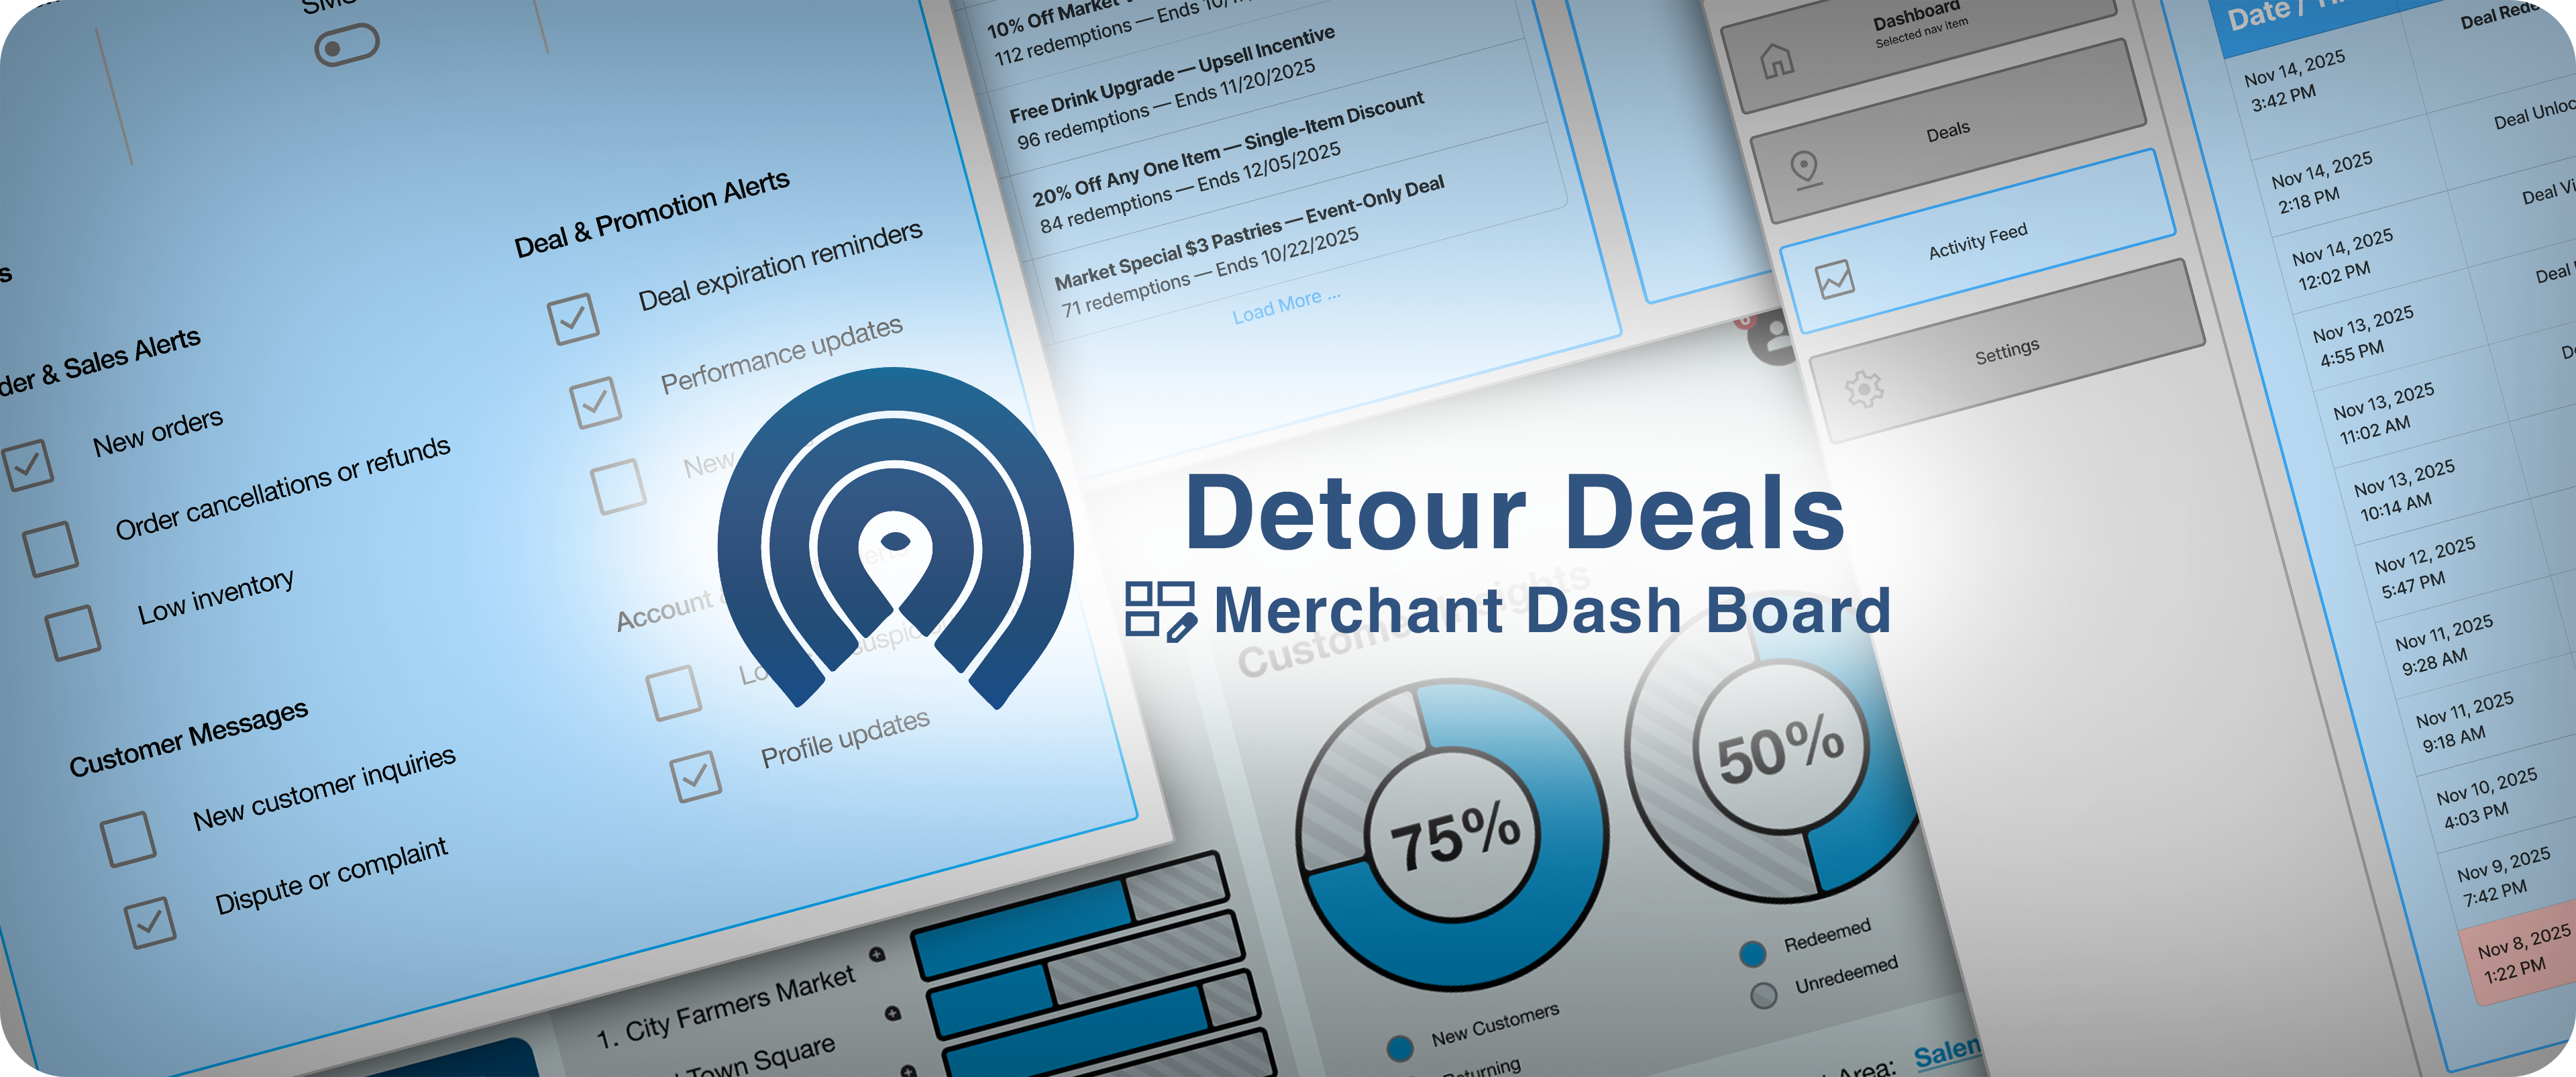
Visual Direction
Early high-fidelity explorations that informed the structure and layout of the wireframes.